
This is a SaaS release.
Introducing our new API reference documentation
We're excited to announce a complete overhaul of our API documentation, designed to provide a better experience for developers. We've focused on adding more code examples, better explanations, and a more intuitive structure.
Here's a look at what's new:
-
Public access: The API documentation is now open and accessible to everyone without requiring a login.
-
New "Get Started" guide: Jumpstart your integration with a dedicated guide that includes complete, copy-paste-ready code examples.
-
Core concepts explained: We've added detailed explanations for core concepts like Roles, Scanners, Campaigns, and Reports, complete with code samples to show you how they work.
-
Redesigned UI: The new interface makes it easier to navigate our API. We've improved the explanations for every endpoint, so you know exactly what to expect.
-
Product-specific sections: Find what you need faster with new sections dedicated to our Inference Defend and Inference Red-Team products.
-
Chatbot integration guides: Learn how to connect with our platform through our Slack and Microsoft Teams chatbots.
-
Troubleshooting section: Quickly resolve common problems with our new guide to frequent issues and their solutions.
-
Link to product docs: Easy access to our main product documentation for more in-depth information.
Check out the new API documentation here: docs.calypsoai.com.
AI Guardrails
Test scanners with a custom dataset
This release introduces the ability to evaluate scanners using your own dataset of prompts, giving teams a reliable way to measure accuracy, detect false positives and negatives, and fine-tune scanner performance before publishing.
Users can now:
-
Upload a custom CSV dataset containing prompts and their expected outcomes (
truefor prompts that should be blocked,falsefor prompts that should be allowed). -
Automatically validate uploaded datasets – checking file size, header names, column count, and label format.
-
Run tests against specific scanners and versions, or compare multiple versions at once.
-
View detailed performance metrics, including:
-
F1 score (when both
trueandfalselabels are present) -
Confusion matrix with true positives, true negatives, false positives, and false negatives
-
Overall accuracy
-
-
Download a detailed CSV report showing scanner decisions for each prompt (available for 7 days).
-
Track test history in the Dataset tab, including test name, dataset used, scanner versions tested, and timestamps.
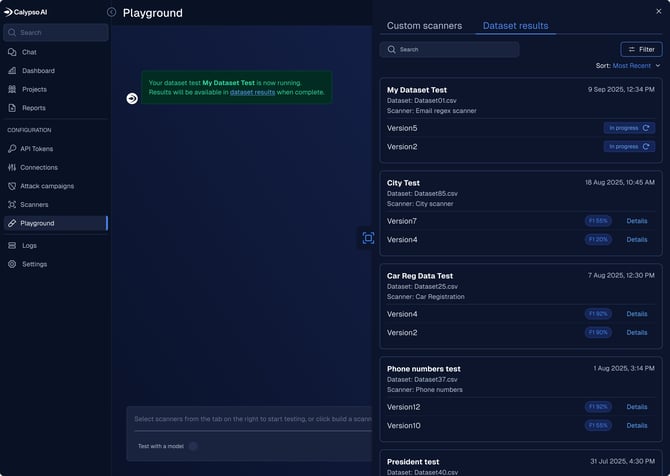
To run a test, go to the Playground, click Upload dataset in the top-right corner, and follow the guidance in the upload wizard. After the test completes, click View dataset results in the success message to open the report.
Each test appears as a card in the Dataset Results tab, showing progress or the final F1 score. From there, click Details to view the full confusion matrix and performance breakdown.
The most recent F1 score also appears in the Version history panel of that scanner, making it easy to see how performance changes across versions.
Tips for success:
-
Datasets must contain both
trueandfalselabels to calculate an F1 score. -
If only one label type is present, accuracy metrics are shown but no F1 score is calculated.
-
Download links for test reports expire after 7 days.
For more details, go to: Testing scanners with a custom dataset
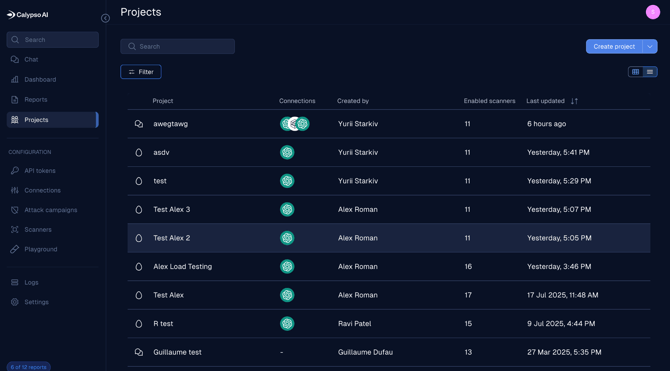
View projects in table or card layout
This release introduces a new table view for Projects, giving users more flexibility in how they view and manage their workspace.
You can now toggle between the card view and the new table view using the layout switcher icons in the top-right corner. Both views share the same filters and search funcationality; filters applied in one view automatically carry over to the other.
This update improves visibility for large environments and makes it easier to compare project metadata side by side.
Redacted content now returned in Scans API responses
The /scans API now includes redacted content directly in the response when a scanner with a redact action is triggered. This enhancement:
-
Eliminates extra API calls: The redacted prompt is now in the original response, removing the need for an additional request to fetch the sanitized data, especially in out-of-band deployments.
-
Reduces API load and simplifies integration.
-
Ensures consistency for subsequent processing steps.
AI Red Team
Quick view of mitigation actions
This release introduces a new column in the Reports table to give you a faster, at-a-glance summary of the volume of recommended actions for each campaign run.
NOTE: Actions counts are not backward compatible, and are shown for new reports only.
-
When testing two scanner versions with a custom dataset, the F1 score is shown for one version in the scanner’s version history, but not the second version. Both scores do appear in the Playground > Dataset results panel, however.
-
The Upload and test a dataset wizards links to the support website instead of the relevant article.
Bug fixes
-
In data tables, the default sort was not highlighted. Resolution: Where applicable, the default sort column in the table is highlighted with a blue underline and sort arrows.
-
The Scanner list was missing certain scanners, such as the PII Scanner, under specific sorting options. Resolution: Fixed.
-
The API Reference documentation link was not visible for Red-Team-only users. Resolution: Fixed.
-
The Campaign name text overflowed its table column when the name was too long. Resolution: Fixed.
-
The buttons in all pop-ups had an incorrect height of 40px instead of 32px. Resolution: Fixed.
-
Parts of the Campaign filters were not visible on smaller screens due to oversized layout elements. Resolution: Fixed.
-
Outcome Analysis selection produced inconsistent visuals depending on the order of card selection (different spans shown). Resolution: Fixed.
-
The alert message displayed an incomplete and unclear sentence (“The default model is,”) when no connections were enabled. Resolution: Fixed — the alert now clearly states that no default model is selected.
-
The Playground displayed blocked responses in title case instead of sentence case. Resolution: Fixed.
-
The View raw data button was visible even when reports were canceled or had no data available. Resolution: Fixed — the button now appears only when the report state is Error or Complete.
-
One of the buttons on the Projects page was the wrong size. Resolution: Fixed.
-
There were small sizing and alignment issues on the Reports table that affected the user experience. Resolution: Fixed.
-
In the configuration screen for Other providers, the Provider display name dropdown was formatted incorrectly. Resolution: Fixed.